 Observation Time Plot
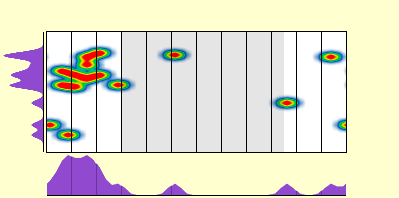
About the Observation Time Plots
This plots shows the elevations and times of year where the plant Gaultheria caespitosa has been observed. The elevation histogram is on the left side. The time-of-year histogram is at the bottom. The largest area is a temperature plot showing both the elevation and time-of-year when the species was observed. Note that the elevation scale is nonlinear with more resolution near sea level.
Observation Time Plot License
These plots use data from many sources listed at this Attribution and Copyright link. The plots are licensed under a Creative Commons Attribution-NonCommercial-ShareAlike license.